
Conversions and revenue
What the dashboard counts as a conversion and as revenue, the two settings that decide it, and why the two columns move independently
Set the Conversion Event to Subscribed to Newsletter and the Revenue column does not drop to zero. That is not a mistake. Conversions and Revenue answer two different questions, and two settings in the control bar ask them. The Conversion Event says which event you are counting. The Revenue Group says which events' money you are counting. Each column follows its own setting, and only one choice ties them together: set the Revenue Group to Conversion Event, and Revenue counts the revenue of the conversions and nothing else.
Conversions: the event you choose
A conversion is one occurrence of the event you pick as the Conversion Event: Order Paid, Signed Up, Demo Requested, or any event your site or a conversion integration sends. The choice is saved with your view, and three figures move with it: Cost Per Conversion, Conversion Rate and Revenue Per Conversion.
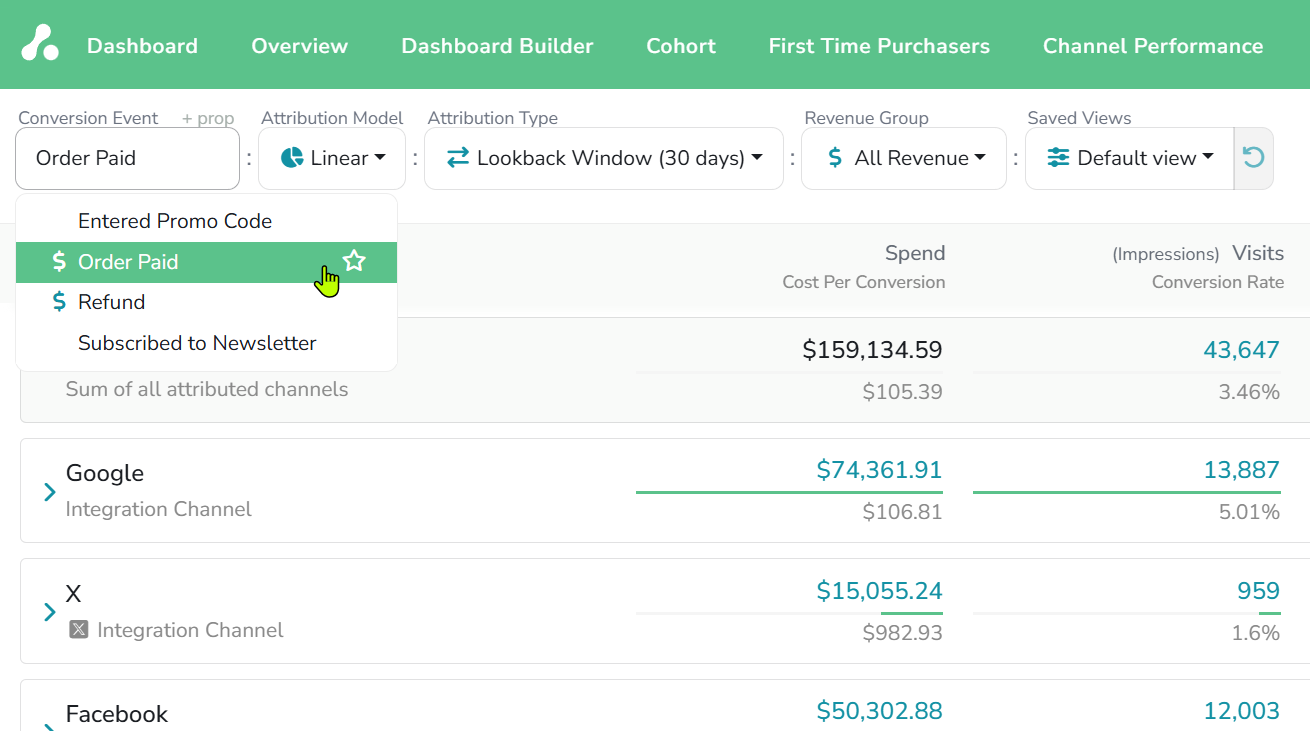
Events that carry revenue show a $ in the list; the star pins one to the top, and + prop narrows the event to one property value. The Dashboard page describes the control. Under a multi-touch model a conversion is split across the visits that led to it, which is why a row can show 0.33 of one; see Attribution models.
Revenue: the events that carry money
Revenue is a property on an event. Your site sends it with track('Order Paid', { revenue: 120 }), and the conversion integrations send it on the events they create: a paid invoice, a won deal, a completed order. Any event can carry revenue, whether or not it is the Conversion Event. The Revenue Group picks which of those events the Revenue column adds up:
| Revenue Group | Counts |
|---|---|
| All Revenue | Every event that carries revenue. The default, and right for most projects. |
| Conversion Event | Only the revenue on the event chosen as the Conversion Event. |
| Your own groups | Only the revenue events you tick for the group. |
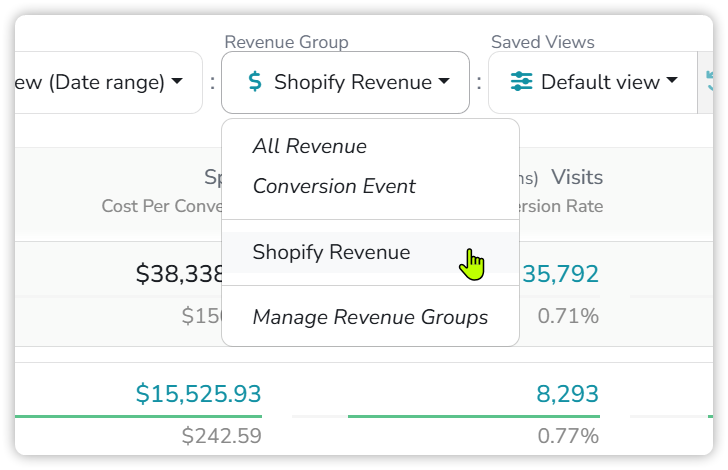
Your own groups are made under Manage Revenue Groups, at the bottom of the dropdown, which opens Project Settings. Click Add Revenue Group, name it and tick the events it counts; the list offers every event that has ever carried revenue. Groups belong to the project, and each view picks one.
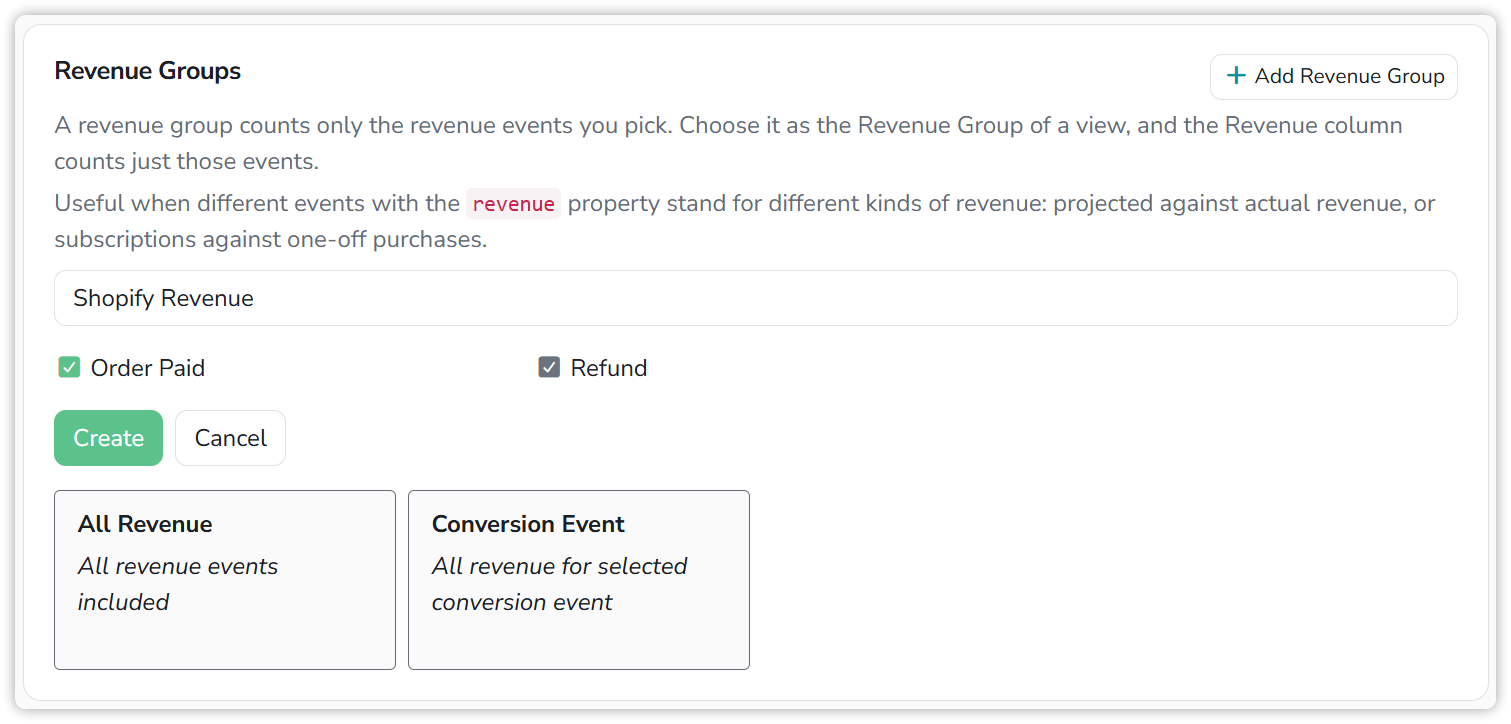
A group earns its place when different events carry different kinds of money: projected against actual revenue, subscriptions against one-off purchases, or a store's sales against its refunds. The group in the example counts Order Paid and Refund together. That works because the Shopify integration sends a refund as negative revenue, so the column shows sales net of refunds. Send your own refund events the same way, with a negative revenue; leaving refunds out of a group is the other option, but then the column overstates what you kept.
One revenue figure per eventAn event carries one
revenuevalue. If your events hold several, net and gross, or MRR and ARR, we can split them for you: the event is copied under a suffixed name,Order Paid (revenue_with_tax)say, with its revenue taken from the other field, so each figure becomes an event you can pick or group. Write to [email protected] to set it up.
Two columns, two questions
The demo project for April 2024 shows what the separation buys. With Order Paid as the Conversion Event, All Traffic has 1,510 conversions and $348,100 of revenue, the numbers on the Dashboard page. Switch the Conversion Event to Subscribed to Newsletter: All Traffic now has 695 conversions, and revenue is still $348,100. Google drops from 696.18 conversions to 501.23 and keeps its $160,163.33.
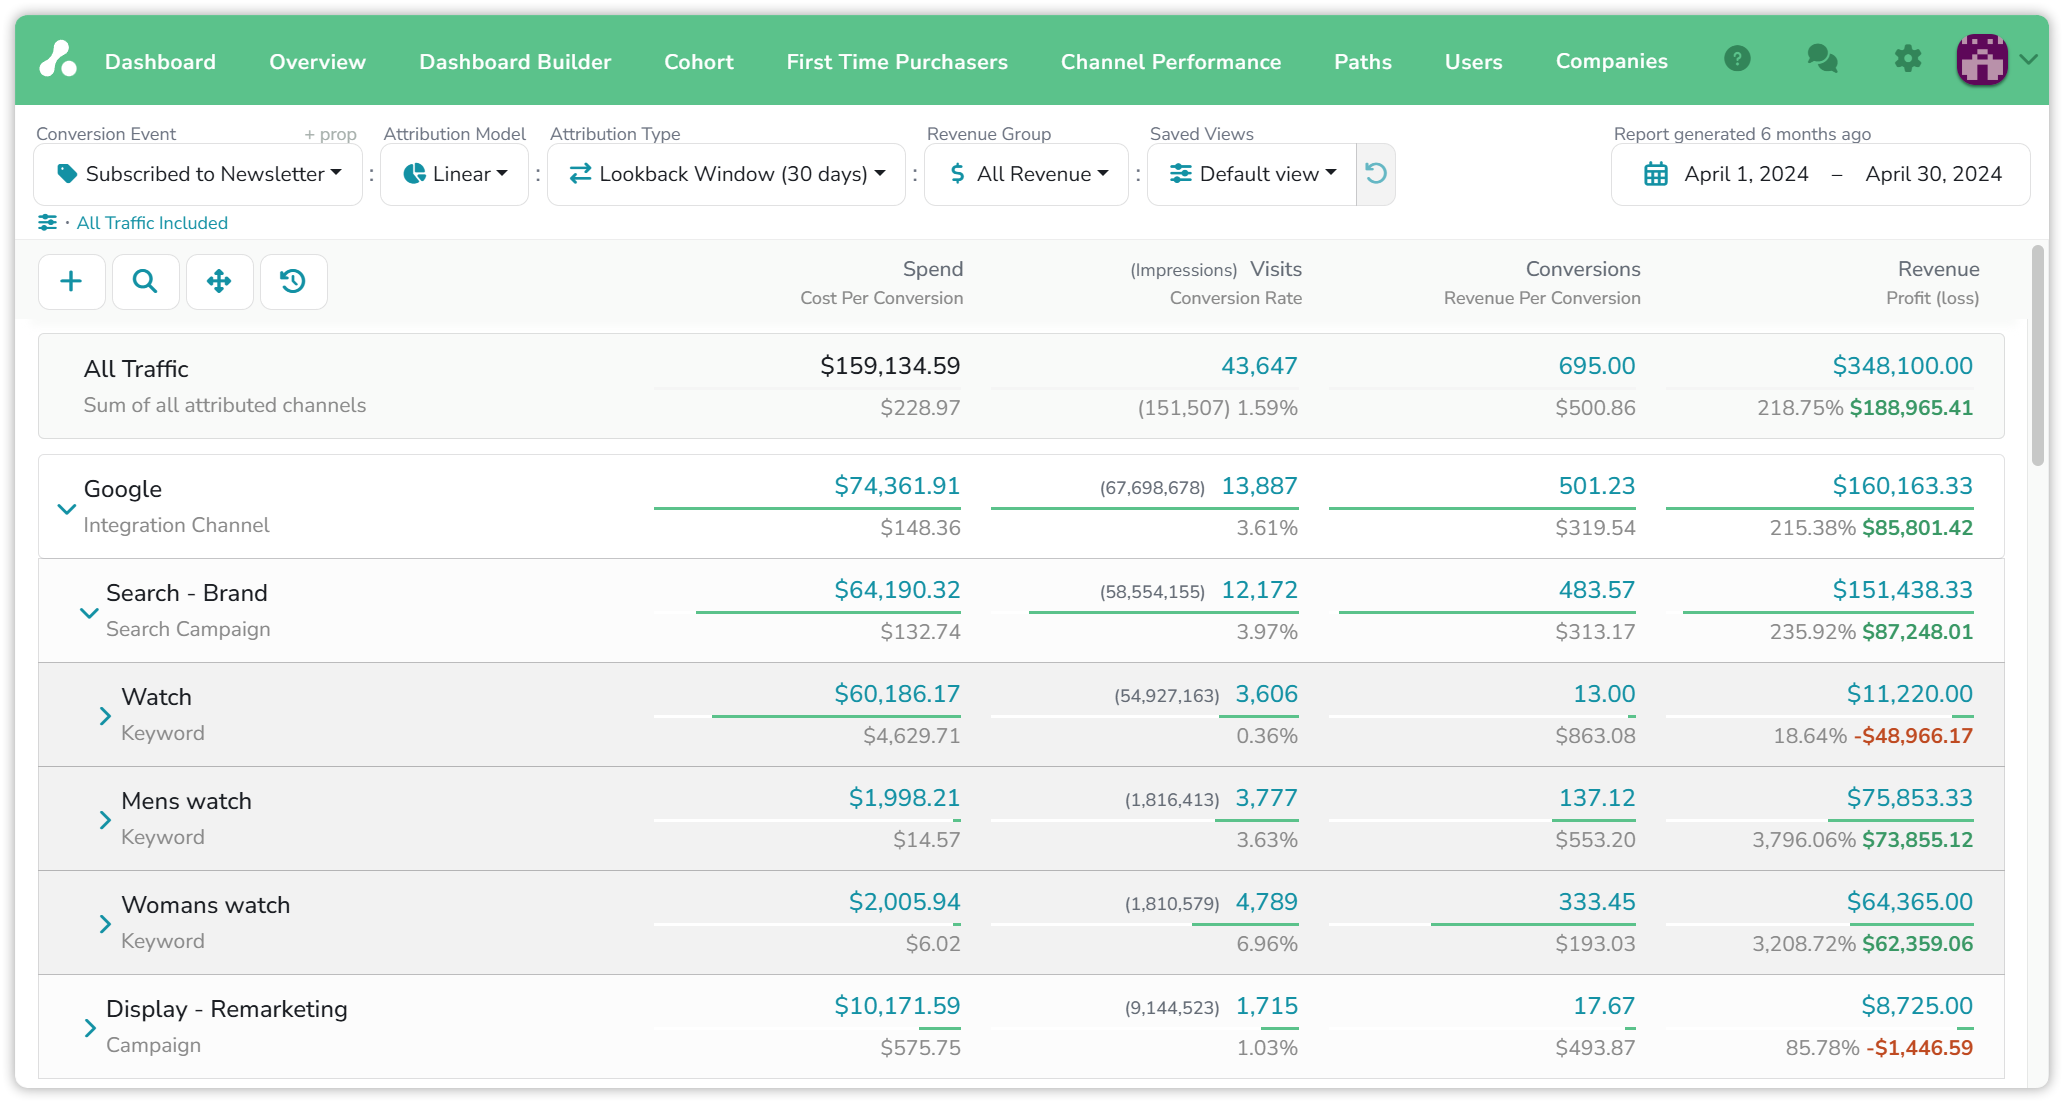
Now read one row against another. Womans watch brings the most newsletter sign-ups, 333.45 of them. Mens watch brings fewer, 137.12, and more revenue, $75,853.33 against $64,365.00. One keyword fills the list, the other fills the till, and the table says so on two adjacent rows. That is the question a lead event as the Conversion Event lets you ask: which channels bring the people, and which of those people turn into money.
The same happens in miniature on From visit to conversion: switch its Conversion Event from Order Paid to Demo Requested and every row keeps its $40, because the $120 sits on Order Paid and All Revenue counts it regardless.
Revenue is credited by the same model as conversions, split across the visits before the revenue event. It is not limited to visitors who also converted on the Conversion Event.
Reading the numbers
- Changing the Revenue Group never changes the Conversions column, and changing the Conversion Event never changes Revenue, unless the Revenue Group is Conversion Event.
- Revenue Per Conversion divides Revenue by Conversions. With a lead event as the Conversion Event it reads as revenue per lead, not the value of an order: $500.86 per newsletter sign-up on All Traffic in the example.
- A revenue group whose events did not occur in the date range gives a Revenue column of zero while Conversions keep counting.
- Raw Traffic, at the bottom of the dashboard, shows conversions and revenue before any model: the row to check against your own systems.
- Which conversions and revenue fall inside the date range depends on the Attribution Type.
If you have any questions, write to [email protected].
Updated about 2 hours ago