
Dashboard
How to read the dashboard: what the control bar sets, what each column means, how the rows are organised, and how to open any number to the visitors behind it
The dashboard is the report everything else in Attribution builds on. It answers one question for every channel: in this date range, under these settings, what did we spend here, how many visits and conversions did it bring, and what revenue came of it. Read a row left to right and it is a sentence: in April 2024, under a linear model, we spent $74,362 on Google, got 13,887 visits and 696 orders, which produced $160,163 in revenue, a return of 215%.
The reason to read it this way is that each ad platform reports only itself. Say a product sells for $8 and a typical buyer clicks a Google ad and then a Meta ad, each at $5 a click. Both platforms report the sale and a $3 profit. The dashboard puts the two clicks on one journey and shows the truth: $10 to acquire an $8 sale, a $2 loss. Every number on it can be opened to the visitors and visits it was calculated from, which is what makes it an audit rather than a chart.
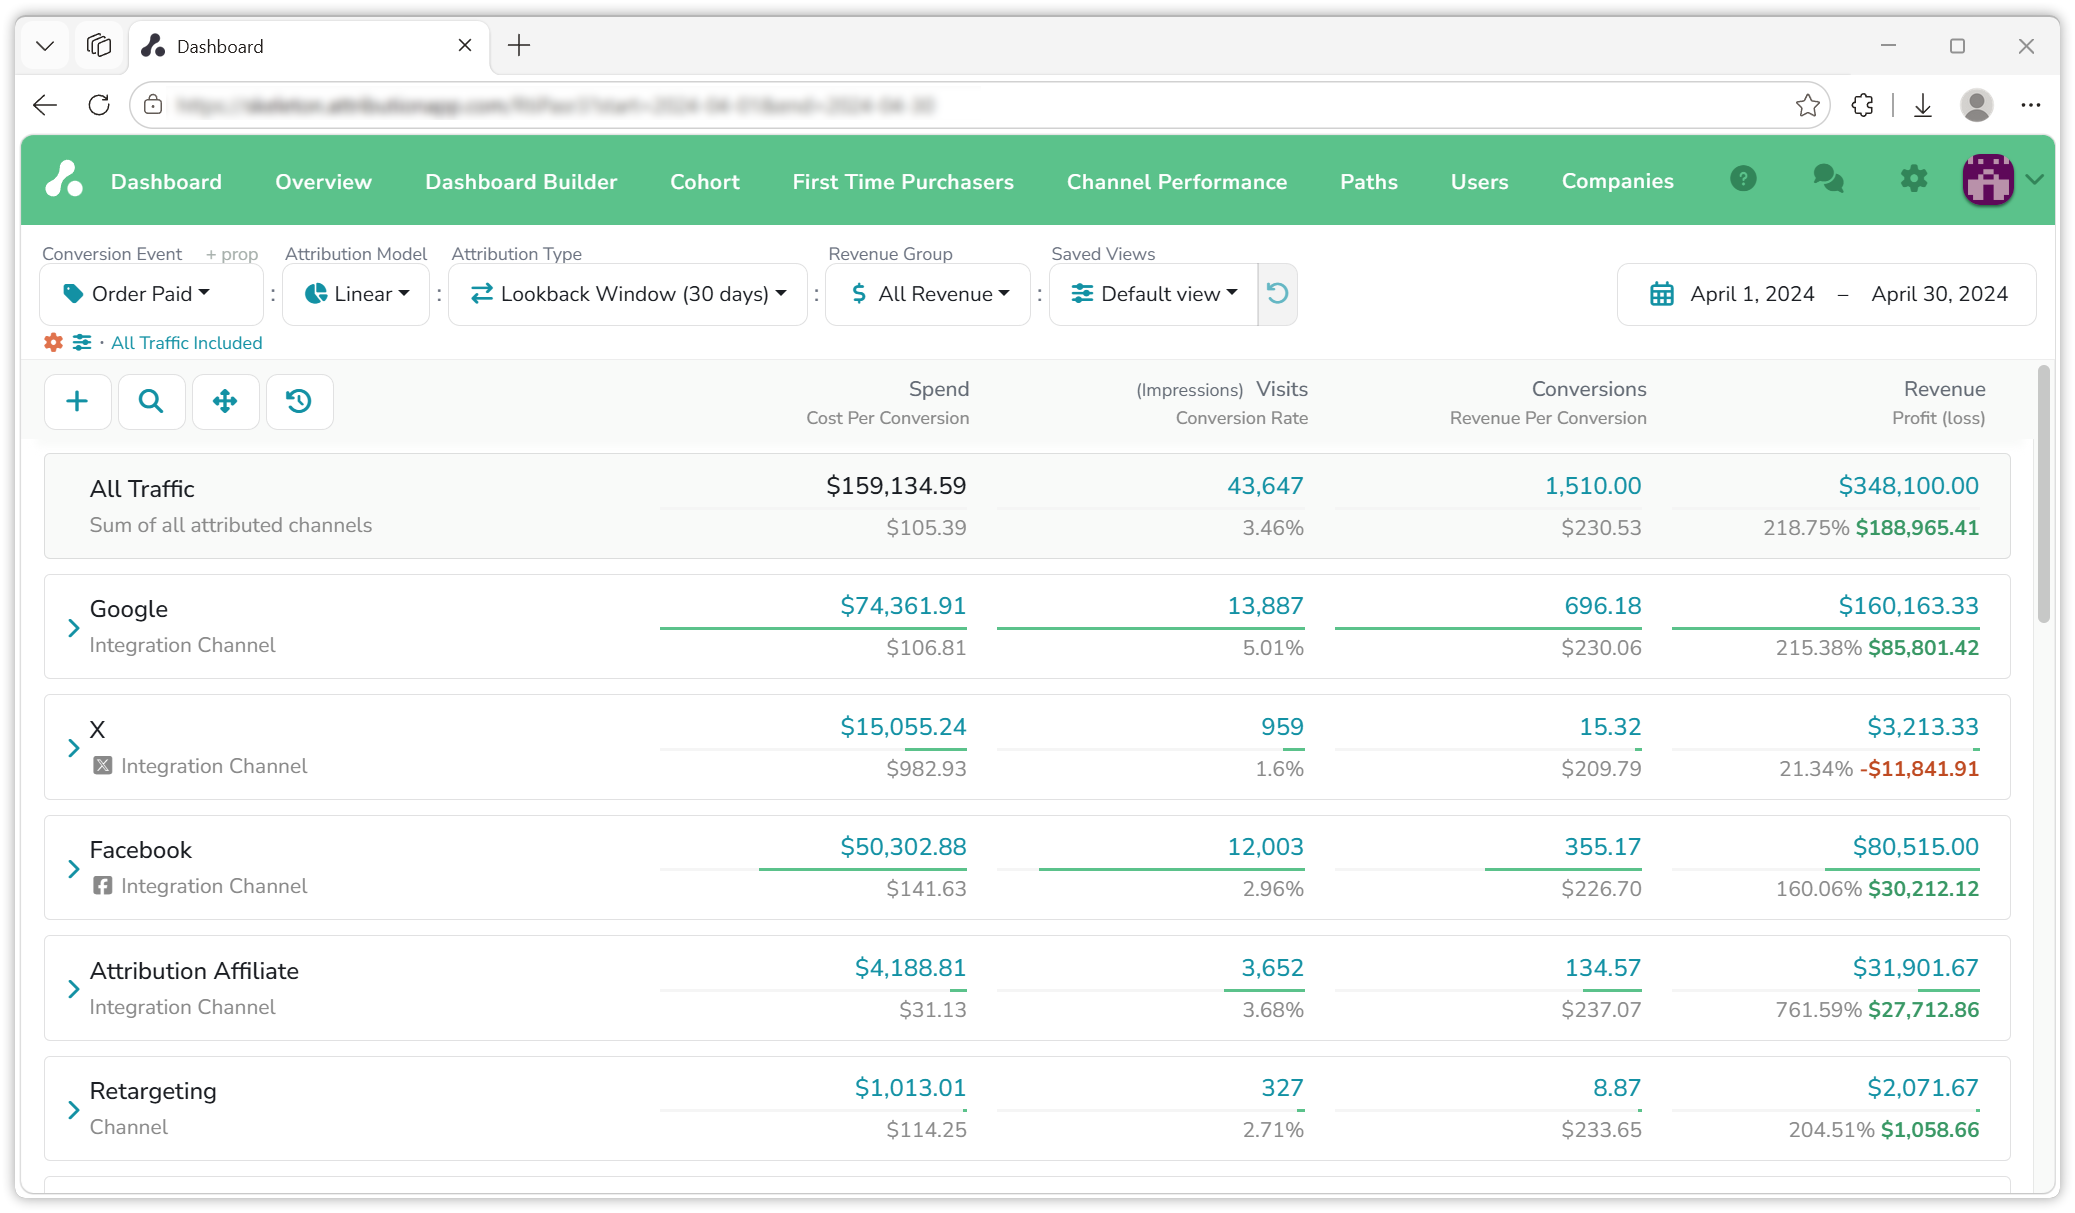
The control bar
The settings along the top decide what the numbers mean. Each is a setting of your saved view, so a change is remembered and the other reports read the same choice.
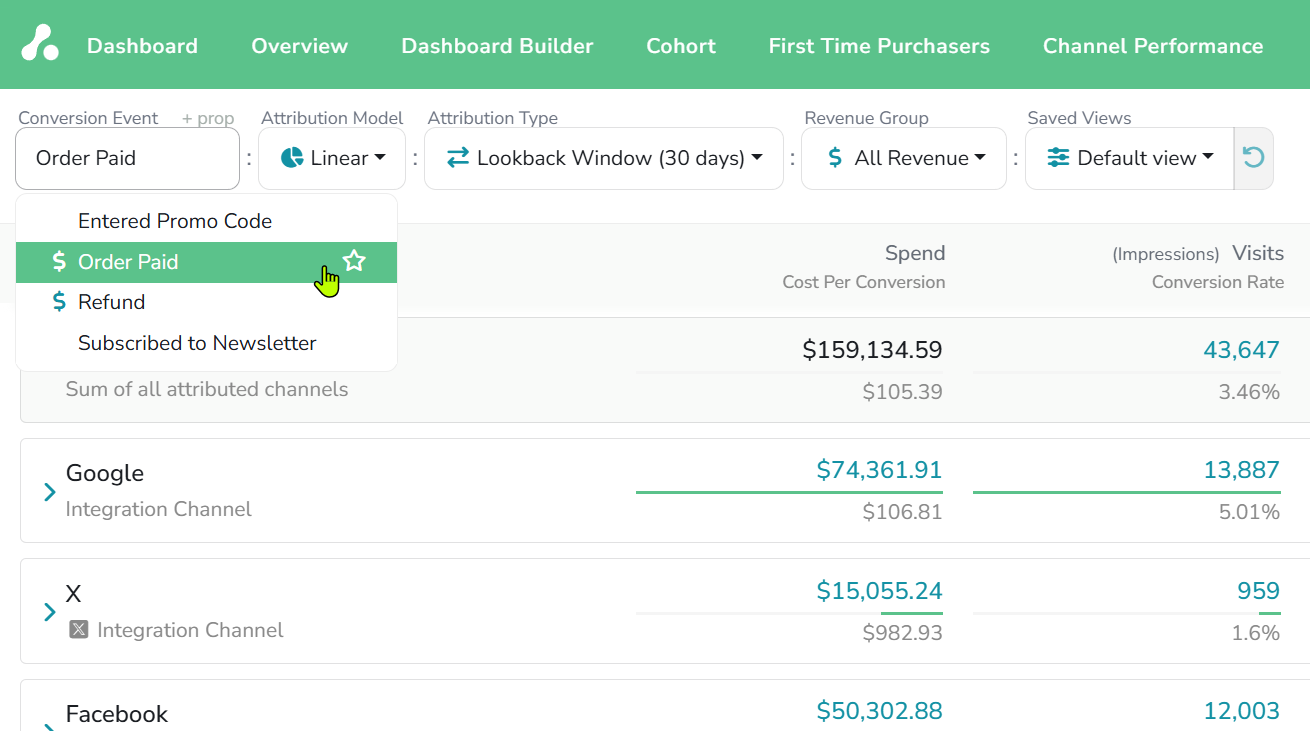
- Conversion Event. The event the dashboard measures against: Order Paid, Signed Up, Trial Started or any event you track. Events that carry revenue are marked with a
$; the star next to an event pins it to the top of the list. + prop narrows the event to those with a given property key and value, for examplecategory=watches. Changing the event changes the Conversions column and everything derived from it; Revenue is independent, see below.
- Attribution Model. How a conversion's credit is split among the visits before it: Linear, First Touch, Last Touch, Time Decay or Position Based. Switching it re-splits the same data, nothing is lost. The rules are on Attribution models.
- Attribution Type. Lookback Window, which takes the conversions in the range and looks back a set number of days for their visits, or Marketer Spend View, which takes the visits in the range and looks forward to what they produced. Which visits and conversions each puts in the range is on Attribution types.
- Revenue Group. Which events count in the Revenue column: All Revenue, the conversion event alone, or a group of events you define. How the two columns relate, and when to make a group, is on Conversions and revenue.
- Saved Views. Switch between named sets of all the above, or save the current one. A view can also hide channels, which collapse to the bottom, so one project can carry a view for the content team that counts sign-ups and shows no paid channels, and another for the performance team. The arrow next to it resets unsaved changes.
- Date range, at the right. The dates the range selects, conversions under Lookback Window, visits under Marketer Spend View.
Under the Conversion Event, the current traffic option is shown, "All Traffic Included" by default; click it to change whether direct visits take a share of the credit.
The columns
Eight columns, in the order they appear. Four are measured; four are derived from them.
| Column | What it is |
|---|---|
| Spend | What the channel cost in the range: from the ad integration, updated daily, or imported. |
| Cost Per Conversion | Spend divided by conversions. |
| Visits | The visits credited to the channel. For ad channels the platform's impressions are shown in brackets beside it. |
| Conversion Rate | Conversions divided by visits. |
| Conversions | The conversion event, split by the model, so a channel can earn 0.5 of a conversion. |
| Revenue Per Conversion | Revenue divided by conversions. |
| Revenue | The revenue credited to the channel, split by the same model. |
| Profit (loss) | Revenue minus spend, in green or red, with return on ad spend, revenue divided by spend, as the percentage beside it. |
Spend belongs to a filter; a channel shows the sum of its filters. It arrives from the ad integrations once a day, and for any other filter you can enter it yourself, by date or as a CSV; see Channels, filters & groups. Spend is never modeled; it is the amount reported or entered.
Conversions and Revenue are independent. Conversions counts the event chosen in the control bar; Revenue counts the revenue events of your revenue group, split by the same model. So a dashboard set to Signed Up still shows revenue in the Revenue column, and that is the point: one table shows which channels bring the sign-ups and which bring the money. Conversions and revenue walks through it on the demo project.
Each column header carries two metrics, the measured one on top and the derived one below, and each row shows both. Values can be shown as absolute numbers or relative to the total, from the toggle in the header.
The rows
- All Traffic, the first row, is the total after modeling: every attributed channel added up.
- Integration channels are built for you. Connect Google Ads or Meta and the channel appears with its campaigns, ad groups and keywords as rows beneath it, spend attached, visits matched to them by their tracking parameters. Expand a channel and the same eight columns apply at every level, which is how a keyword that loses money sits next to one that returns thirty times its spend.
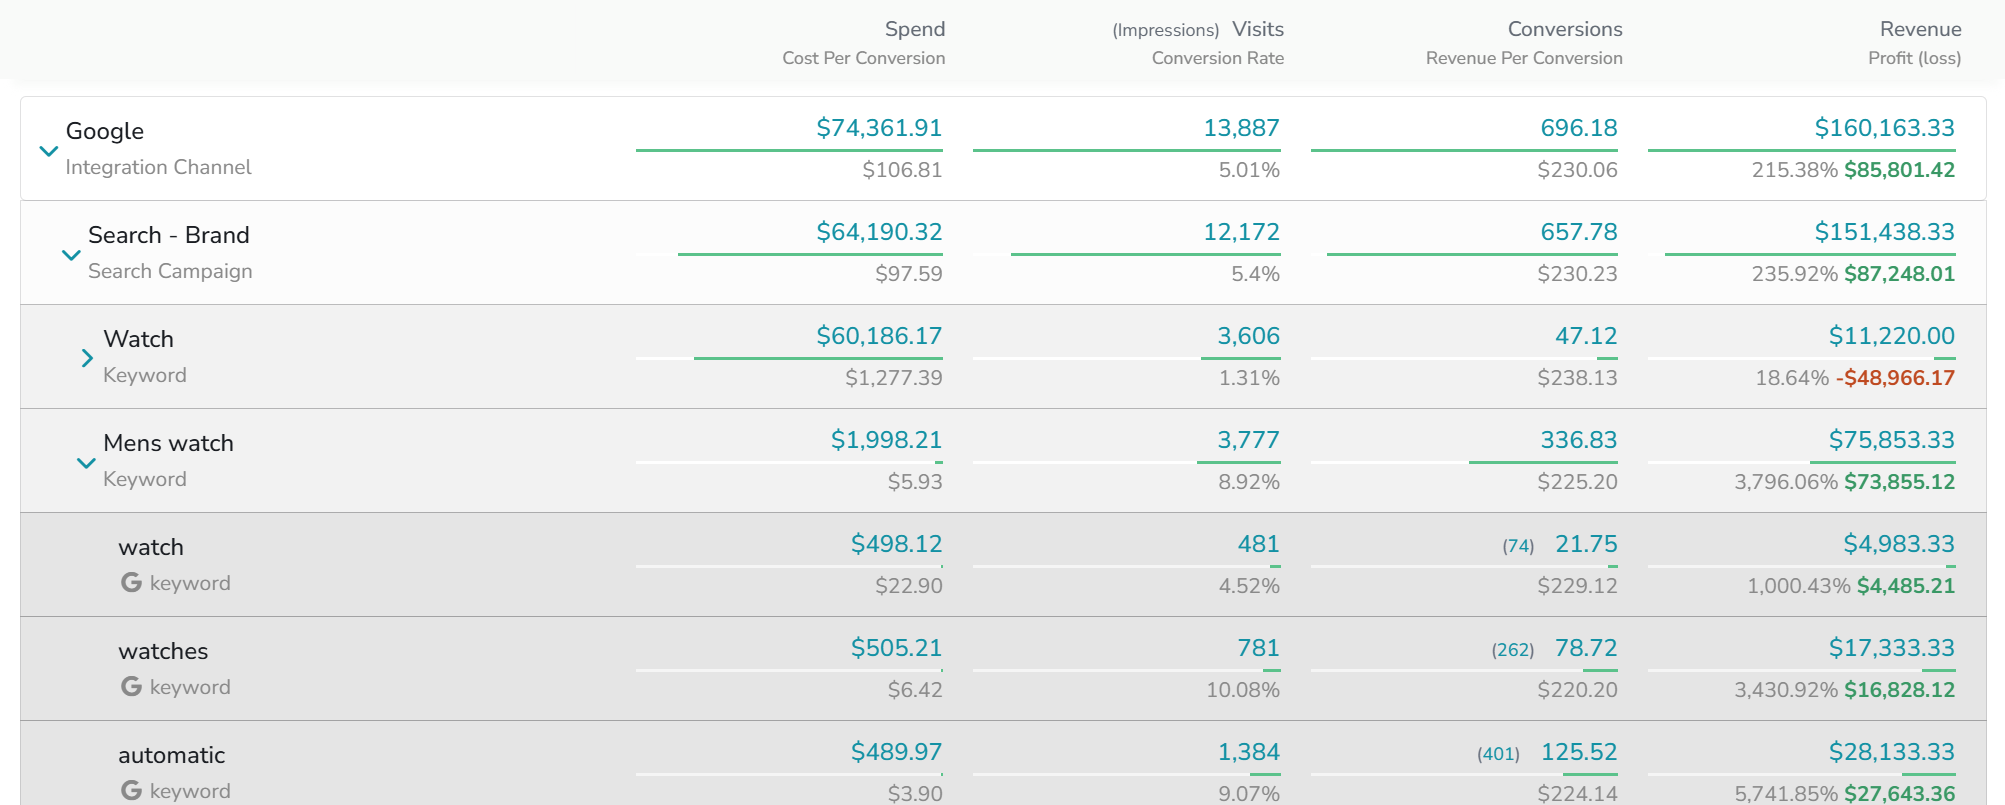
- Your channels and filters are the rows you create for everything else: a filter claims visits by a URL parameter, a referrer, an organic source, a landing path or an event; a channel gathers filters under one row, and channels can nest. Groups add up chosen channels and filters without taking anything from them, for a view such as all paid channels together. Add them from the header buttons, arrange them by dragging, or upload filters as a CSV. What they are and how they are matched is on Channels, filters & groups.
- Direct Traffic, Unsegmented Traffic and Unknown Source are the default rows that catch what the others do not: visits with no referrer and no parameters, visits no filter claims yet, and conversions with no visit to credit. Each is explained on Default channels; the Dashboard Builder is where Unsegmented traffic is turned into filters.
- Raw Traffic, shown when you click Show Raw data at the bottom, is every visit, conversion and revenue dated in the range before any modeling: the row to check against your own systems. Beside that button, Breakdown Direct Traffic splits the Direct Traffic row by the page the visit landed on, and Download CSV exports the table as shown.
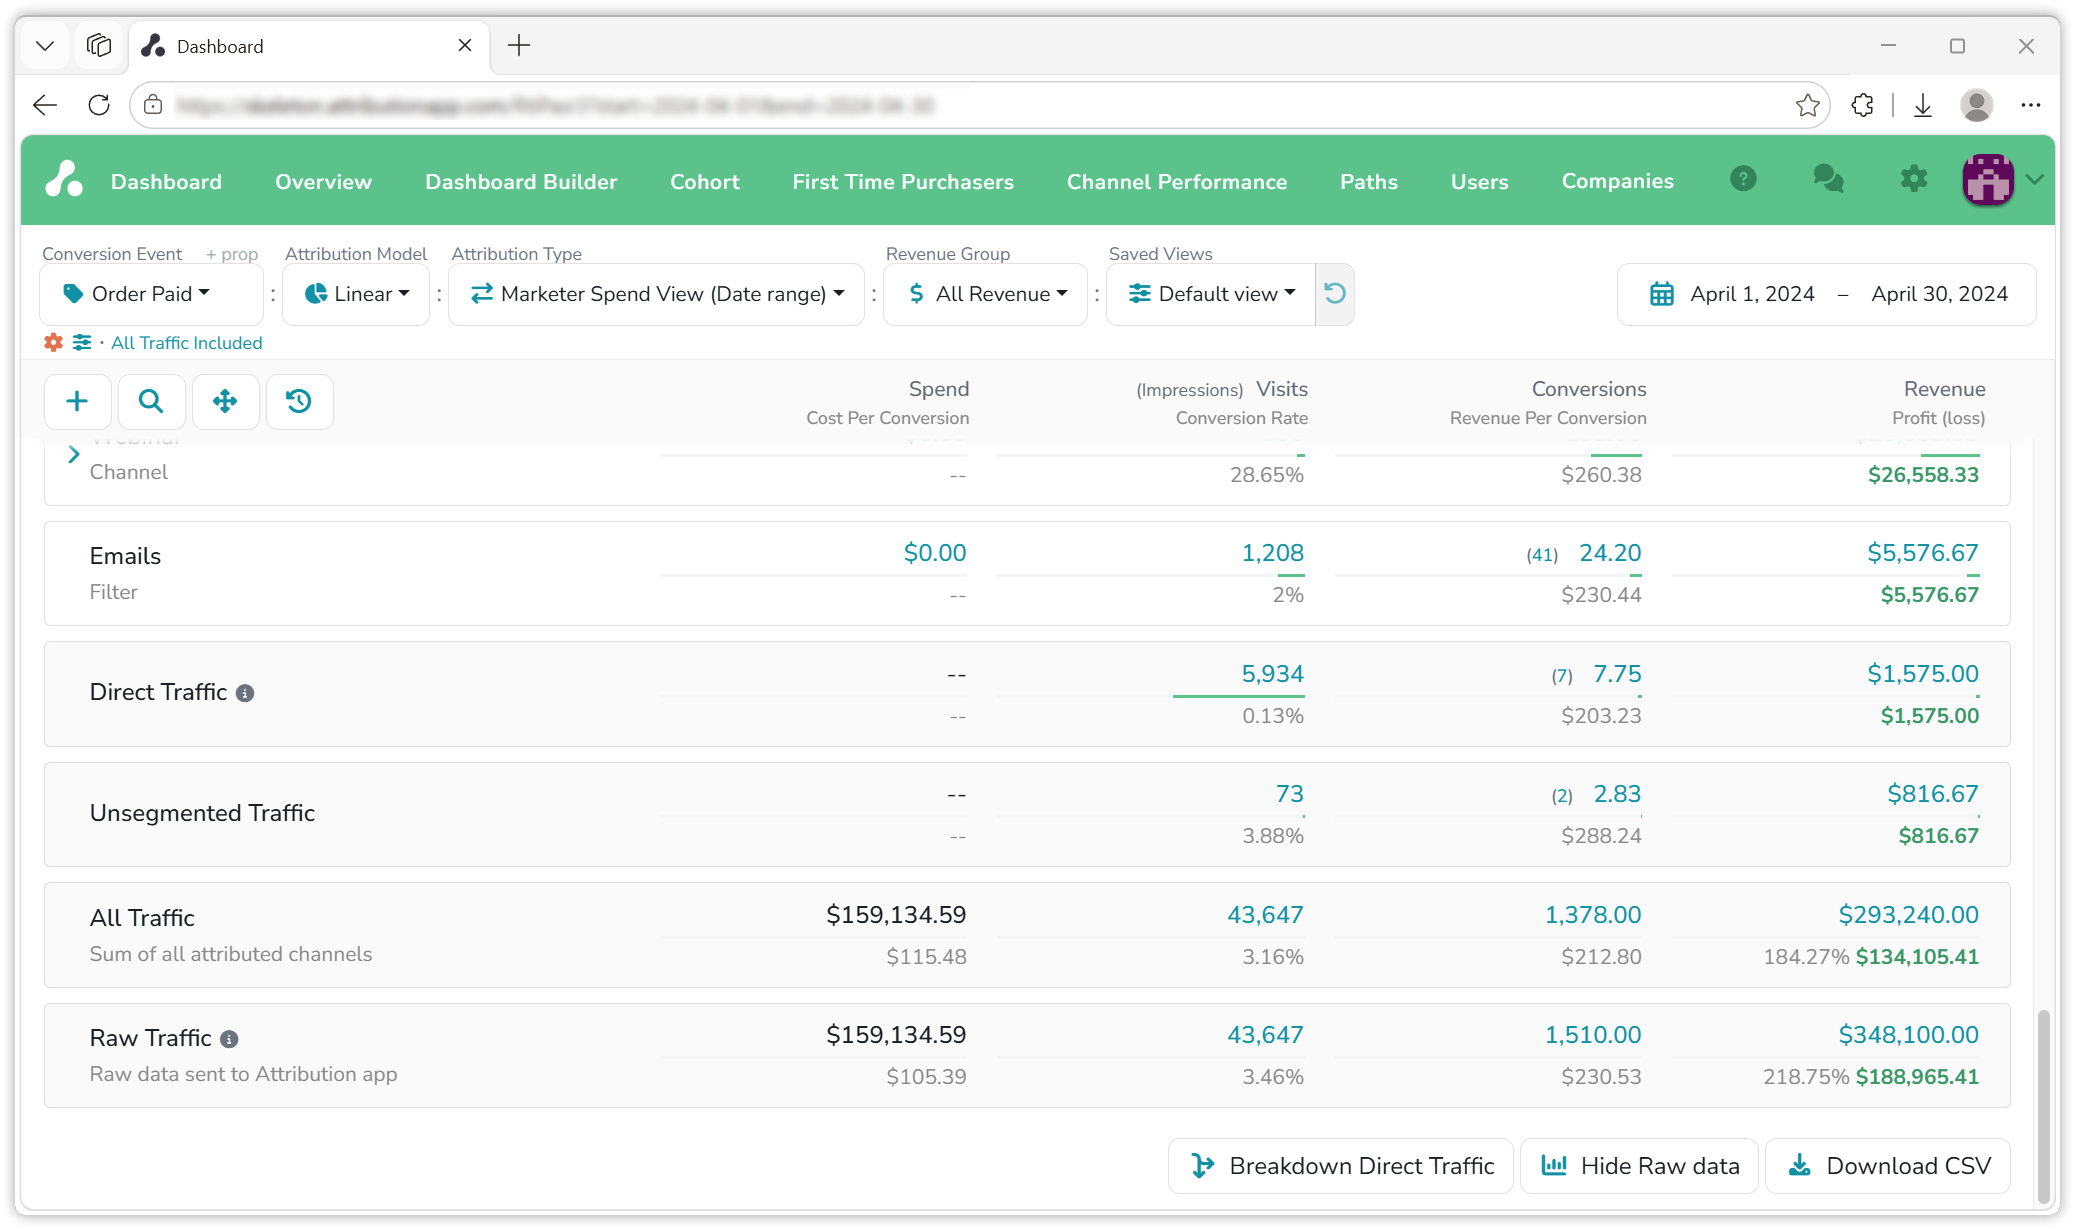
The toolbar above the rows adds a channel, filter or group, searches filters by name, switches Arrange mode for dragging rows, and toggles the period breakdown of the Timeframe report. Every row has a menu: show its landing pages instead of its filters, open it in the Cohort report or the Dashboard Builder, jump to the campaign on the ad platform, rename, edit, hide or disable it, add it to a group. The full list is on Channels, filters & groups.
The sidebar
Every blue figure opens a sidebar with the data it was calculated from. Four columns open one:
- Spend shows the spend behind the figure by date, whether it came from the ad platform or was entered by hand, and is where you add spend to a filter yourself.
- Visits lists every visitor whose visits were credited to the row in the range.
- Conversions lists every visitor who converted with a visit to this row in their journey, and next to each one their share of the conversion. Under a single-touch model the share is 1; under a multi-touch model it is the fraction the model gave this row, 0.5 when the visit was one of two, and the fractions add up to the number in the column.
- Revenue lists the same visitors with their share of the revenue.
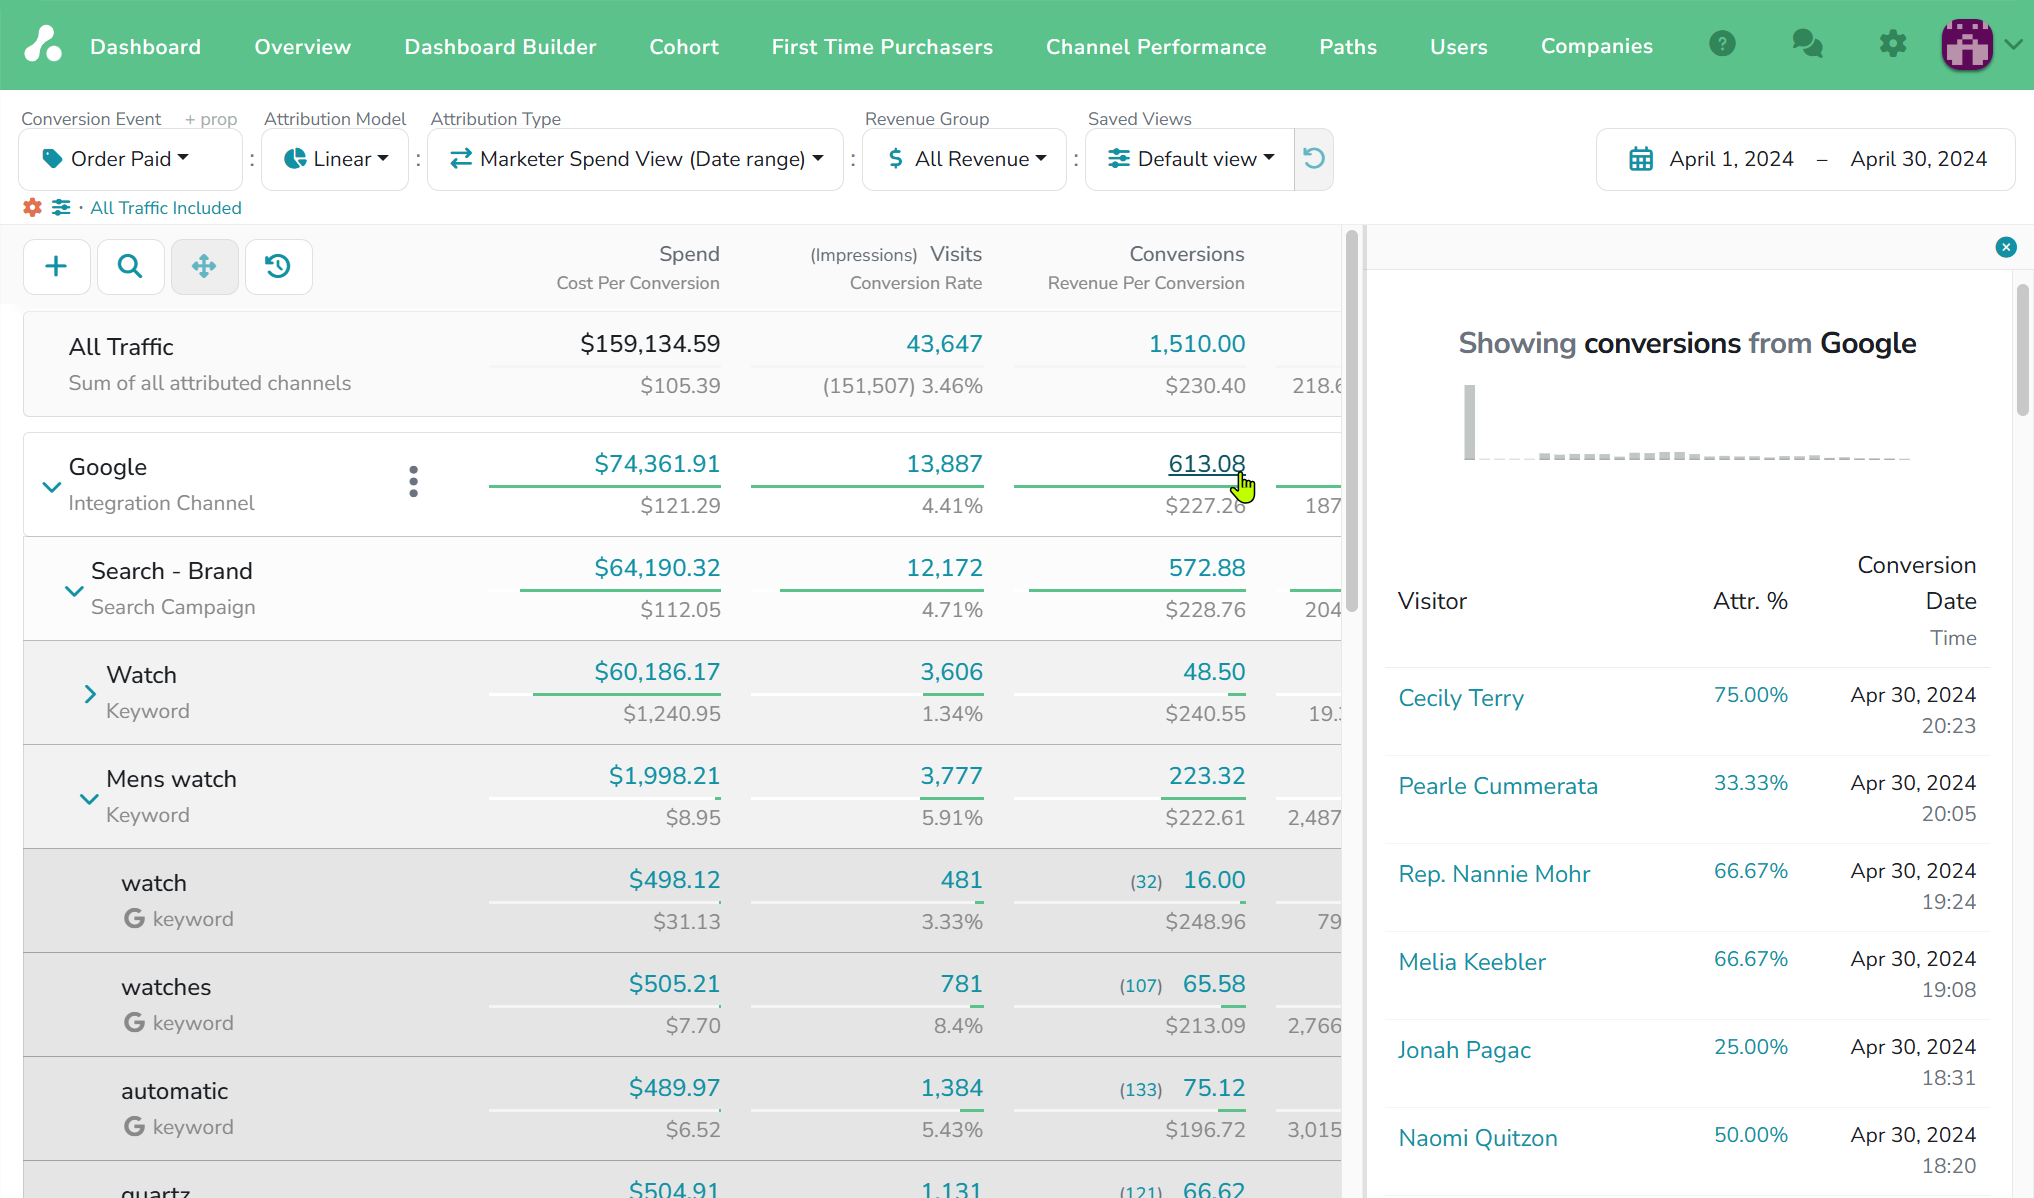
A visitor appears by name and email when your site identified them, and by an anonymous id when it did not; both are listed and both count. Click a visitor, their name or their anonymous id, and the sidebar shows their whole timeline: the traits your site sent, their visits, pageviews, events and lifetime value, the first touch and the path as a row of channels, and then each visit by date with the channel and filter it was credited to, its spend, the pages viewed, and the events along the way with their revenue.
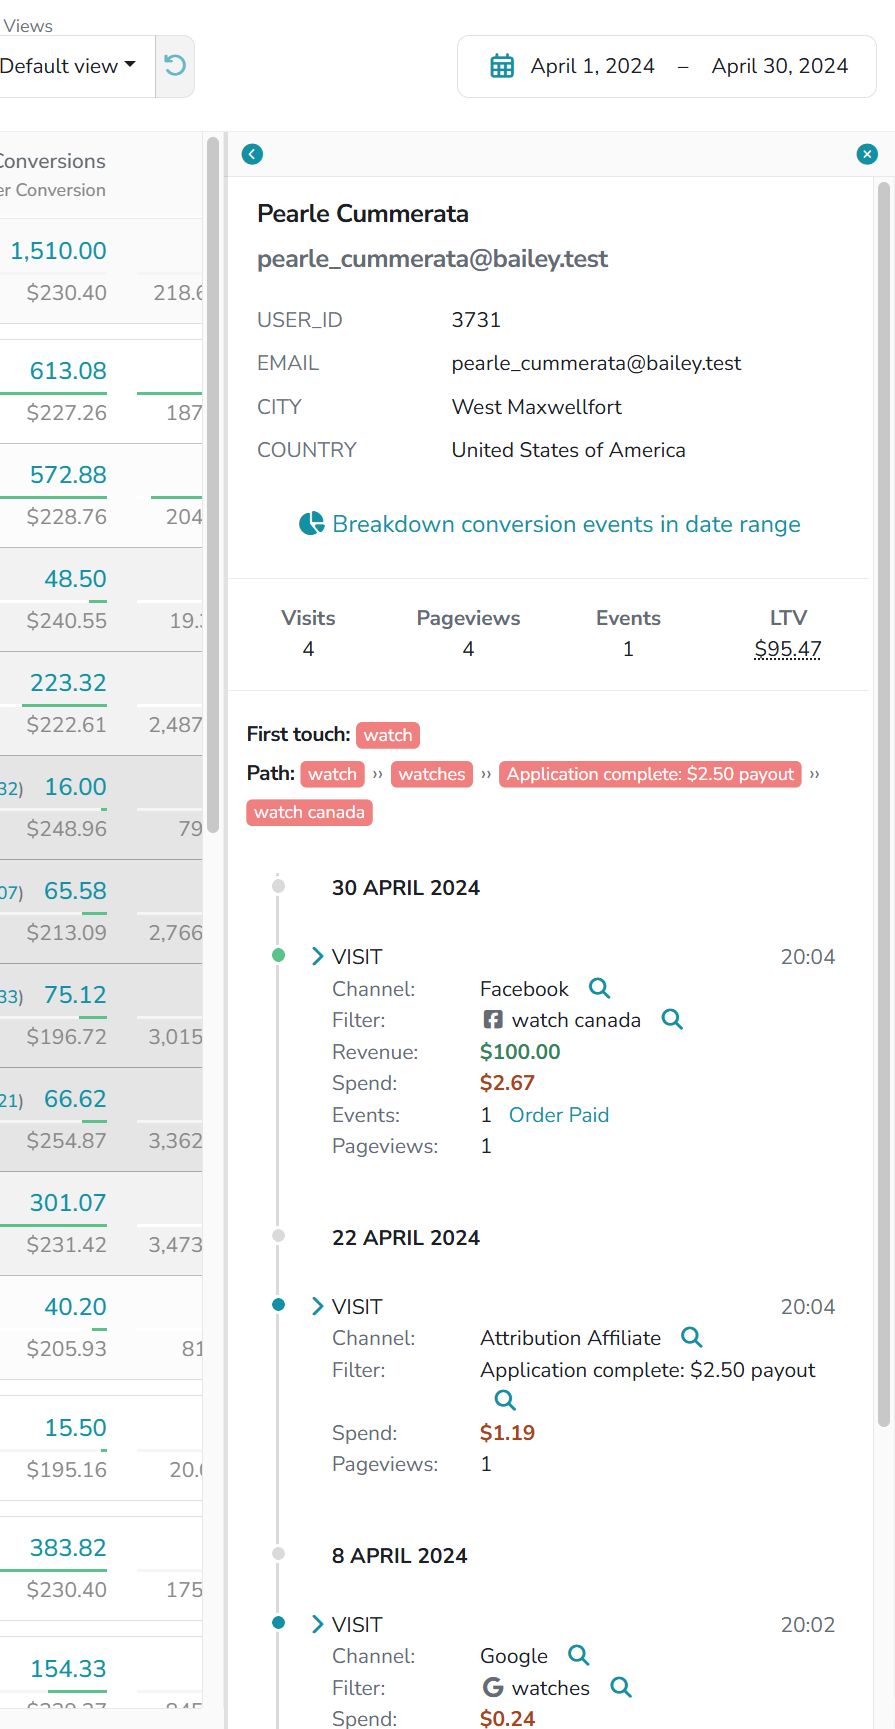
Nothing on the dashboard is a black box: every figure is a sum over the visitors in its sidebar, and every visitor is a journey you can read. The Users page finds a visitor by email and opens the same journey.
This is where a surprising number gets explained. A store running ads on Google, Meta, Twitter and an affiliate network saw every platform report itself profitable. On the dashboard under Linear, Twitter showed a loss. Opening the Twitter row showed its visitors, and their journeys showed the pattern: Twitter visits came early, and the people who converted had come back through Google or the affiliate before buying. Twitter was starting journeys it rarely finished, which no platform reports about itself.
Settings that clean the data first
Raw data is never changed. A few settings decide what the model is allowed to see, and all of them can be switched back:
- Traffic options, in the view, decide whether direct visits take credit, and whether they stop at a cutoff event such as the sign-up. A product people log into every day otherwise shows Direct Traffic swallowing the credit for every return. See Traffic options.
- Ignored Channels, in Project Settings, keep a filter's visits out of the model. The case that calls for it: a trial confirmation email whose link fires a visit right before the conversion, so the email takes the credit the ad earned.
- Company-based attribution, a project setting, joins everyone from one company into one journey, so the analyst who asked for a demo and the director who signed share the credit. It can be switched off to count individual sign-ups again. See Company-based attribution.
Reading the numbers
- Conversions and Revenue are independent columns; a change of conversion event moves one and not the other.
- All Traffic and Raw Traffic differ by design. Raw counts by date; All Traffic counts what the model credited. A conversion whose visits fall outside the lookback window, or that arrived with no visit at all, is in Raw Traffic and not in All Traffic. See Default channels.
- Under Marketer Spend View a period's numbers keep growing as the visits in it collect later conversions. Under Lookback Window a period is final once it ends. See Attribution types.
- Modeled numbers cannot be reconciled with another tool's; no other tool splits credit the same way. Reconcile Raw Traffic instead.
Beyond the dashboard
The other reports take the same modeled data and ask one question each: Cohort, how fast a period's spend paid back and what those customers are worth since; Paths, which sequences of channels lead to a conversion; First Time Purchasers, how much revenue came from new customers and which channels brought them; Channel Performance, the dashboard as charts, with every channel under all five models; Overview, any two dashboard metrics over time; and Timeframe, this table broken down by period.
If you have any questions please contact [email protected].
Updated 13 days ago